Showing posts with label Infographic. Show all posts

Siri v/s Google Assistant - Which is the Best? [Infographic]

Siri v/s Google Assistant

The iOS users still remember the excitement Siri stirred when it first hit the market in October 2011. This excitement never faded as Apple continued to update it from time to time with features that users lovingly embraced. However, with the grand appearance Google Assistant made, it became evident that Siri has got some serious competition.

Google Assistant and Siri are more alike than different, which makes picking one out of them a strenuous task. They both handle most of the duties you require an assistant to do, such as calling someone from your phone-book to setting reminders and managing your applications. They act as voice assistants too, and are quick to start up and respond when you request something. However, at one point, their similarities end.

Upon closer inspection, Google Assistant not only proved to have a better memory than Siri, but also have the ability to come up with more accurate answers for random questions you throw at it. You’ll find it easy to love too, with its friendly nature and ability to crack jokes.

The following infographic by Zlated will uncover the entire story behind the battle between Siri and Google Assistant before the winner was announced.

Siri v/s Google Assistant
 

10 Applications to Help with Home Renovations

From mapping out tasks to setting a budget, choosing paint colours and taking precise measurements, home renovation is a multifaceted process. These handy apps are bound to be very helpful for anyone thinking about re-modelling their home.

Here the infographic designed by Halfprice.com.au en-titled with " 10 Apps to Help with Home Renovations " that clearly explain you how these applications will help for you.

Are you agree/disagree with this? Why? Feel free to leave a comment with your experiences. Have a Great Day!
 

The Ultimate Student App Guide [Infographics]

Being a student is both the best and the toughest years of your life. It represents a new dawn as you take your path towards your chosen career and you meet lots of new people and experience a huge amount of different scenarios through your study modules.

It’s an exciting time and certainly an interesting time but it can also be a very stressful time for many. Trying to deal with assignment deadlines, projects and of course exams can be overwhelming. It is very important to keep on top of your projects and other work in order to keep stress out of your life. Of course inevitably, closer to exam time and assignment deadline time, you will probably still feel a degree of stress but this can help with adrenaline and to keep you motivated.

Planning and organisation is required though to ensure you don’t fall behind so take time to set out your plans to cover what you need to cover in a timely manner. You might be a person who works best in a group or perhaps you can only get things done in isolation. Whatever you find works for you, focus on that and find your rhythm.

This infographic below from Study Medicine Europe goes through the many apps that are available for students to help them get through their revision and their studies efficiently. It is broken down into different segments in order to help them along in various aspects of their work. Check it out below.

Are you agree/disagree with this? Why? Feel free to leave a comment with your experiences. Have a Great Day!
 

The EPF Rollback and how it impacts you [Infographic]

Do you know that the tax on your EPF corpus as well as employer’s contribution has been rolled back.

Here’s a quick guide to understanding your EPF and what happens from FY 2016-17 onwards.

The EPF Rollback and how it impacts you

What is EPF?

Employee Provident Fund is
  • a contributory social security scheme
  • applicable to companies with 20 or more employees
  • threshold on contribution is Basic salary of Rs 15,000
How does it work?
  • presently, employee contribution to provident fund is 12% of Basic salary
  • matched by employer* [* 3.67% to EPF, 8.33% to EPS (Employee Pension Scheme)]
  • employer contribution is usually part of CTC
  • total amount earns interest, interest rate notified by Govt each year
  • both EPF and EPS amounts paid out separately during withdrawal
  • rate of interest is currently 8.8% for FY 2015-16
Before 2016-17

EPF Withdrawal
  • after 5 or more years of continuous service
  • after attaining the age of retirement (presently 58)
  • if unemployed for two months or more after leaving previous job
  • for marriage, higher studies, house construction/purchase
  • for medical emergencies
Tax on EPF
  • tax applicable if withdrawn before completion of 5 years of continuous service
  • no tax if withdrawn after 5 years or upon retirement
  • tax status is EEE (Exempt at all stages contribution, accrual, withdrawal)
After 2016-17

EPF Withdrawal
  • only employee contribution and accrued interest on it can be withdrawn prematurely
  • employer contribution stays in your EPF account
  • this can be withdrawn only upon retirement, at 58 years of age
Tax on EPF
  • proposal to tax 60% EPF corpus on withdrawal has been rolled back
  • proposal to tax employer contribution above Rs 1.5 lakhs has been rolled back
  • tax status stays EEE (Exempt during contribution, accrual and withdrawal)
More information on EPF and EPS is available on the EPFO website.

Are you clear now, what is EPF with this Infographic? Why? Feel free to leave a comment, if you have any doubts. Have a Nice Day!

Source
 

Tips on How to Create Good Online Survey [Infographic]

A good online survey is key if you want high response rates. In many instances, people who are not familiar with creating online surveys on a regular basis can neglect to think about the relevance of each and every question they ask or the layout of their survey, for that matter.

Tips on How to Create Good Online Survey

Poorly crafted questions, bad layout and unappealing design can greatly deter people from filling out your survey.

Of course online survey software has made the process of creating surveys a lot simpler; you can design a survey yourself from scratch with intuitive online tools or you can simply choose a questionnaire template and go from there. However, one important factor that you will always need to keep in mind whatever type of survey you create, is that good design and well-crafted questions are imperative if you want results.

In order to ensure a good response rate, you will need to have an impeccablylaid out survey with all questions in a logical order, well-crafted questions that are easy for the respondent’s to read and answer, and importantly, a good design.

For some great tips on how to produce an A1 online survey, check out our info graphic below. Rest assured, you will see the results if you use our expert tips.

Here the infographic designed by Surveygoo en-titled with " Tips on How to Create Good Online Survey " that gives us some great tips on how to produce an A1 online survey, Rest assured, you will see the results if you use our expert tips.

Tips on How to Create Good Online Survey

Are you agree/disagree with this? Why? Feel free to leave a comment with your experiences. Have a Great Day!
 

Why SmartWatches Will Time Out? [Infographic]

Smart Watches are bad value for money, because while comparing the Samsung Galaxy Gear Smart Watch to the iPhone 5S Smartphone shows the real lack of quality features across the board. Today's Smartphone apps are changing our lives in terms of how productive we as a society have become, how we track our movements, where we visit and how we socialise online.
Why SmartWatches Will Time Out?
When developing Smart Watches, someone, somewhere, forget about one major target audience. According to the below infographic - Women won’t buy a Smart Watch. Why? There simply too ugly, too clunky and not an inspirational enough fashion accessory to justify the price point. And, traditionally far more women than men wear a watch, not just to tell time, but as an adornment. Many women see watches as fashion accessories.

No one size fits all. Rules to live by in the rag trade, but what the Smart Watch developers haven’t noticed yet. Wrist size varies and so does eyesight. The screens in most Smart Watches are tiny.

Here the infographic designed by DPFOC en-titled with " Why SmartWatches Will Time Out? " that clearly explain you reasons why Smart Watches are bad value for money.

Why SmartWatches Will Time Out?

Are you agree/disagree with this? Why? Feel free to leave a comment with your experiences. Have a Great Day!
 

What Samsung Mobile Achieved in 2013? [Infographic]

What Samsung Mobile Achieved in 2013?

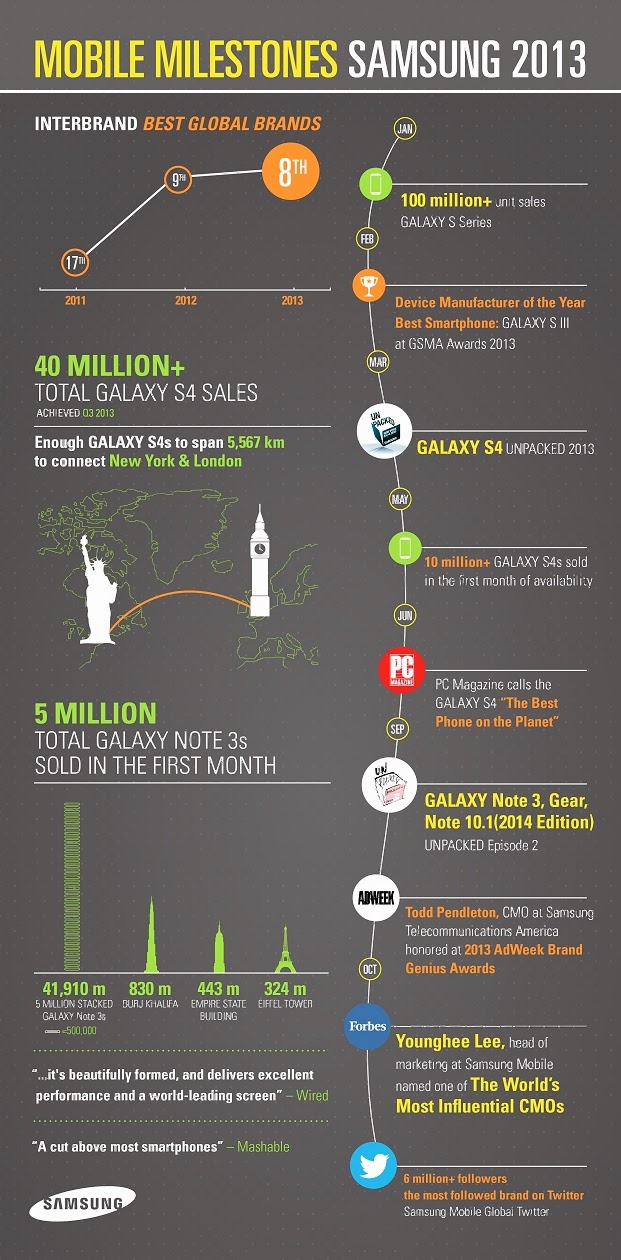
Samsung mobile, one of the world's largest smartphone makers from South Korea launched more mobile phones powered by an Android OS. They would like to justify their emotional reminiscing of 2013.

At the starting of the year, the company launched Galaxy S4 and shipped out globally to connect New York and London (in theory, of course) to announcing the Galaxy Note 3, Galaxy Gear and more, 2013 was full of milestones.

Here the infographic designed by Samsung en-titled with " What Samsung Mobile Achieved in 2013? " shows that 40 million Galaxy S4 devices sold in 2013 and more than 100 million devices in their Galaxy S series.

What Samsung Mobile Achieved in 2013?

Are you agree/disagree with this? Why? Feel free to leave a comment with your experiences. Have a Great Day!
 

Securing Your Online Reputation Vs Preparing Yourself Against Your Competitors

Securing Your Online Reputation Vs Preparing Yourself Against Your Competitors

What is Online Reputation Management?

Since many businesses and customers are online, every bit of information posted and uploaded helps describe a particular product, brand or company. With such convenience, a customer, client or consumer can post reviews or upload photo creditss that will either make or break a particular business image. This is where online reputation management comes in.

Online reputation management is progressive web-based service that can be conducted by an inside or third party. Basically, a person hired inside or outside of your company to manage your reputation online will be responsible in identifying, repairing and establishing your brand. This is eminent through the following things:

  • Read and manage reviews posted on different platforms
  • Create business page and profile online
  • Distribute updates and information on the Internet
  • Conduct branding in available avenues
Why is Online Reputation Management Important?

Whenever a customer wants to research about a business, he will look for the company website, social media page and reviews pertaining to its service and product. It is believed that 75% of Internet users acknowledge the marketing tactics of businesses online. About 90% of online users decide upon what they read on particular reviews whether it is bad or good. With these facts, online reputation management is a marketer’s way to be able to establish a good rapport online since consumers are now dependent on what’s provided to them on the Internet.

In order to do this, there are two types of online reputation management that are explained further below:

Proactive Online Reputation Management

Most marketers would agree that proactive online reputation management is the best way to do it. What you have to do is the establish your presence online way before bad feedback takes over the Internet. This move already signifies that you have built a strong and high wall when it comes to your image. You create social profiles, blogs, forums and networks and you update it to engage your followers regularly. This will bring good information whenever searchers look for you online. That’s why in the event of someone who tries to ruin it through posting a bad review about you, you have many platforms that can cover up and remove it.

Reactive Online Reputation Management

Though the proactive approach is most recommended, reactive online reputation management is the mostly used approach. Companies only react when there is an outburst of bad feedback online. This is where repair of online reputation is deemly needed. A company is bothered by the increase of negative feedbacks seen through reviews posted by their clients. As a result, it affects how they conduct their business and obviously, it is visible through sales ratings and percentage. As a remedy, reactive online reputation management is executed.

In this approach, the ORM specialist has to get rid of these bad and negative image that feed the minds of prospective clients. Though some are can hardly be repaired, this approach requires heavy and constant updating of profiles, blogs, networks and social media pages online. With effective ways, a business can recover from this.

Author Bio: Robert Smith is an effective specialist from one of the online reputation management companies in New York. He also utilizes good infographics to distribute noteworthy articles to online readers.
 

What is the Role of Smartphones in Making Us Busy? [Infographic]

Today, the 90 percentage of people using a smartphone in this world. In recent survey - 65% of iPhone owners said "I Can't Live Without My iPhone," as below infographic shows.

What is the Role of Smartphones in Making Us Busy?

Here the infographic designed with Co-Production of Coupon Audit and TecSemo en-titled with " What Is the Role Of Smartphones In Making Us Busy? " that provides -- how smartphones are making us busy?.

What is the Role of Smartphones in Making Us Busy?

This Infographic is produced by Coupon Audit and Tech Semo

.


Are you agree/disagree with this? Why? Feel free to leave a comment with your experiences. Have a Great Day!
 

Present Information in an Epic Way


Present Information in an Epic Way

Let’s face it, how information is given to a person directly affects how it is processed and whether or not it is retained. By presenting information in a way that is both interesting and memorable, you can increase the retention rate. This is very important because if no one remembers the key elements of what you are saying, all your time amounts to nothing more than a waste. There are a number of easy and effective options that you can choose from when compiling the information that you hope to present. These modes of communicating information will ensure that your valuable time was not spent in vane.

Prezi

Prezi is a cloud based software designed in a collaborative effort between some outstanding software companies. It enables the user to present information in a virtual area. Due to the fact that it is cloud type software, it can be accessed and collaborated on by many different people at different locations. This makes it a great choice for projects that have more than one person working on them. It eliminates the need for transferring files and even the need to be in the same country. As an added bonus there is even an app for the iPad.

Infographics

Infographics are a compilation of text and graphics. They are eye-catching, usually colorful and have a good resonation with the public. The combination of text and graphics can help your subjects more easily process the ideas that you present and promote a better understanding of the concept. Infographics are not a new concept, they have been used for many centuries and for many purposes. Some of the earliest known were used to help humanity better understand the world around them and how it works. Present day infographics include items such as subway and transportation maps. There are many elements that need to be considered in order to have an infographic succeed at its intended purpose. This includes the wording, the graphic element, the spatial layout and the color scheme. It can sound complicated, but that is why there are services and programs that can help you to design an awesome infographic like Infographic World.

Animation

Never underestimate the power of animation. Presenting information as an animated short will help make it more memorable and there are programs available online to help you. If the information that you are dealing with can be presented in a skit form, you may want to consider this method. The programs available range in the level of knowledge needed to operate them. For instance POW is an animation program that is very basic and is marketed toward kids.

The information that you are trying to present is obviously important. If it wasn’t then you wouldn’t be knowledge, you will be ensuring that it is not forgotten. Many of the different presentation methods will also transfer well to social media outlets, blogs and YouTube. So if social media is a part of your marketing strategy, and it should be, you could end up with a great presentation and some exceptional content.

Author Bio: Marianne Ross is a freelance writer and an occasional guest-blogger who shares her business related tips on various blogs.
 

How to use Google Glass and How does it works? [Video & Infographic]

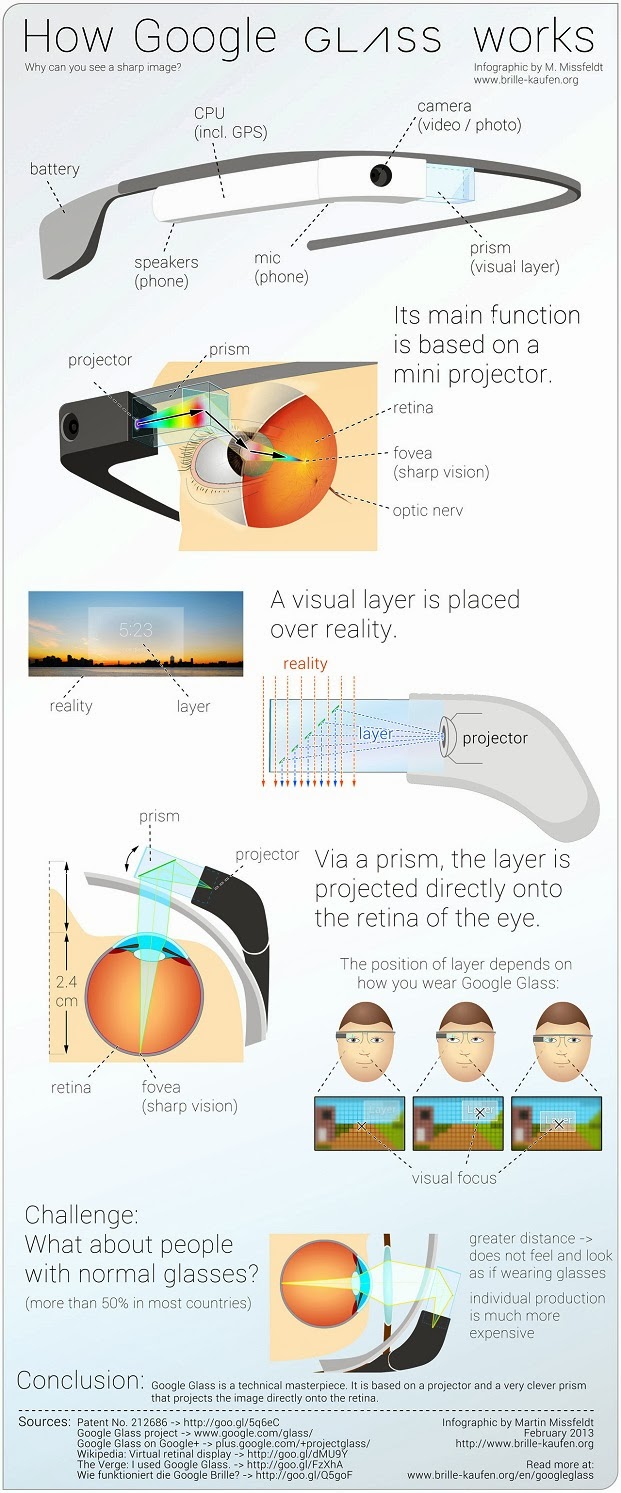
The Search Engine Giant- -Google has released a new video that demonstrate us, How to use Google Glass? How does it works? Why can you see with it a sharp image-layer? How does the image overlay the image of reality?

How to use Google Glass and How does it works?

Google Glass is a technical masterpiece. It combines numerous functions and features in a very small unit. In addition to phone and camera (photo, video), it offers Internet connection, including GPS. Just click here to view complete specifications of Google Glass

Here is the Video


The following infographic was developed by Brille-kaufen.org that illustrates the optical principle - very simple and easy to understand.

How to use Google Glass and How does it works?

Have you understood all the features on Google Glass, If you are still in doubt, feel free to contact us in the comment section below.
 

How to Get a Perfect Job by Social Media Websites? [Infographic]

Do you know, How job seekers and employers are connecting online? The simple answer is 'Social Resume,' nowadays 1 out of 6 job seekers credit social media with landing their current job. The advantage of social media features to enrich your Social Resume with your creativity and personality.

How to Get a Perfect Job by Social Media Websites?

Here is the interesting Infographic created by Onlinecolleges.com titled that explains how social media can help you to land your next job!

How to Get a Perfect Job by Social Media Websites?

Are you agree/disagree with this Infographic? Why? Feel free to leave a comment with your experiences. Have a Nice Day!
 

Top Most Asked Questions in Interview and How to Answer Them [Infographic]

An interview is important for employers, as it assists them in selecting the best suitable person for the job; and it also helps the candidates to present their knowledge and skills to acquire the desired job role. One should always be prepared well in advance for the interview, as it helps in many ways. Your body language and the way of answering questions matters the most in any interview. A successful interview clears your path to landing your dream job. It’s the best opportunity for the candidates to project a good image about themselves to the employers.
Top Most Asked Questions in Interview
There is huge competition in today’s world, which makes it even more challenging to clear an interview with flying colors. With increasing number of job aspirants out there, employers are devising new ways of choosing the right individuals. They want to make sure that the person fits the job role perfectly. The questions asked in the interview are targeted at extracting necessary information from the candidates. You should know how to answer certain questions, which are often asked in most interviews.

Here the infographic designed by Graphs.net for Sample Questionnaire en-titled with " Most Asked Job Interview Questions and How to Answer Them " that provides the most common questions asked in a job interview and the guidelines to answer them.

Top Most Asked Questions in Interview

Are you agree/disagree with this Infographic? Why? Feel free to leave a comment with your experiences. Have a Nice Day!
 

Text Messaging Habits We All Love to Hate [Infographics]

Technology has changed the social sphere alright. It has also carved out a social space where people interact but more than that tech has made it possible for people to come up with different personas, all of their choice, when socializing with others. This has been the case with chatting through internet but is also the case with mobile phone texting. Identification takes place there too, and it doesn’t always have to be in an overt manner.

Infographic - Text Messaging Habits We All Love to Hate


When you pick up your mobile phone after hearing the message tone, you need not look at the name of the texter to recognize who it’s from. Just by reading the text itself, even if it’s a generic ‘hello, how are you’ kind of message, you would most likely be able to gauge who it’s from. This is because individuals have their own unique linguistic signatures. Just by the way a thought is phrased or communicated, one can relate it to their creators. This may be a bit technical and something better left to specialists but just about everyone who receives text messages can understand the idea that people fall into categories of ‘texters’, depending on the style of texting they choose to employ when communicating with different people.

Now the kind of texters you come across can be widely categorized as a couple of handful. Some of the most prominent- -and most interesting ones are mentioned in the infographic below for your viewing pleasure. Just about anyone can relate to being annoyed by a ‘professor’, someone who types out long detailed texts that reading just may induce dizziness. Then of course there are the ‘couples’ who text solely for the purpose of displaying their emotions.

These folks are always glued at their phones and are engaged in endless conversations with their partner. Attempting to text them would probably result in your message going ignored. And speaking of ignored, there are the ‘husband’ kinds of texters. These are the people who always reply late, are least interested in what your text says and are never shy enough to hide it. Beginning to sound a bit familiar? Without realizing it you have most probably adopted these styles yourself, depending on situations. Read on to see whether you fall into any of the categories Mobistealth team painted on an image, or if you know of a certain texter that they missed out on!

Infographic - Text Messaging Habits We All Love to Hate

Are you agree/disagree with this? Why? Feel free to leave a comment with with us. Have a Great Day!
 

What are the Changes Made From Samsung Galaxy S3 to Galaxy S4? [InfoGraphic]

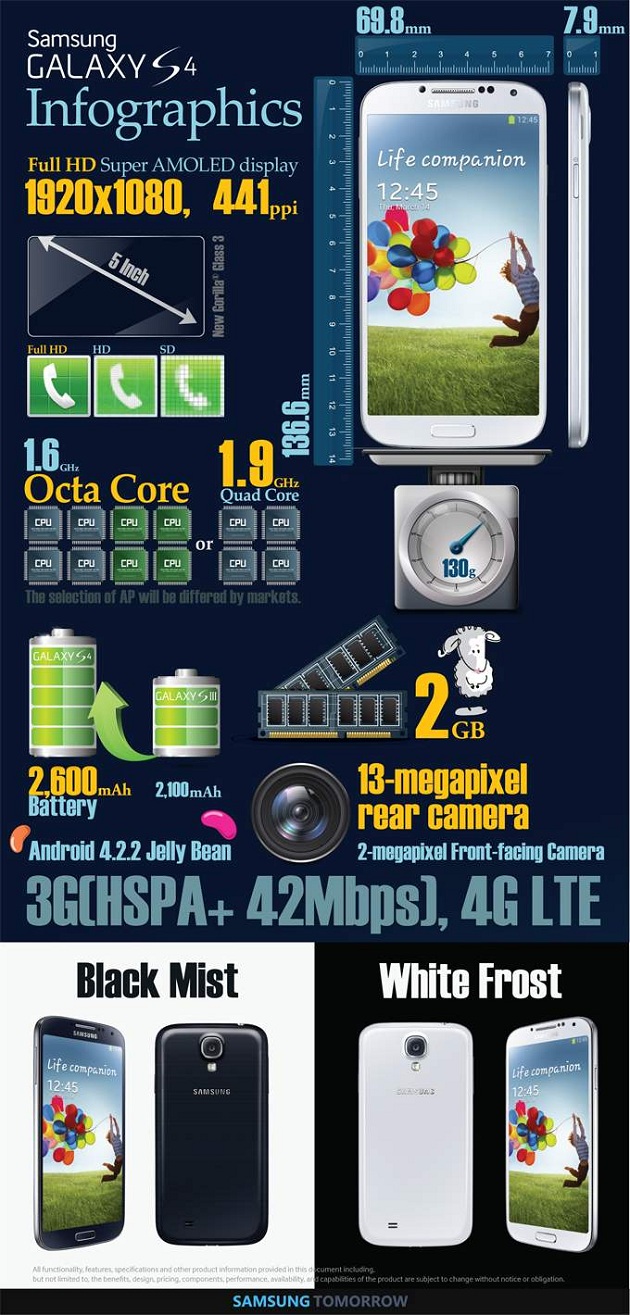
The South-Korean based smartphone maker Samsung has released the Galaxy S4 '4th generation of there Galaxy S series', and now they released an infographic to show us what are the specification changes make from previous Galaxy S3. Here the wonderful opportunity to win your own Galaxy S4.

What are the Changes Made From Samsung Galaxy S3 to Galaxy S4?

Click here to view full specification and features of Galaxy S4 or click here to watch all new accessories for Galaxy S4.
 

World's Top 10 Richest Women in 2013 [Infographic]

Today March 8, 2013, Womens in all over the world celebrating International women's day - So now we see the topic about most successful womens / top 10 richest womens in the world by Forbes ranking.
Here the simple infographic designed by us en-titled with " World's Richest Women's 2013 " that shows the list of top 10 richest womens 2013 in the world by their Net Worth.


Are you agree/disagree with this report? Why? Feel free to leave a comment with your experiences. Happy Women's Day!
 

2013 Women’s Research Reveals How to Make Women Happy In the Workplace [Infographic]

Want to know what makes today’s women happy in the workplace? The Accenture’s Successful research conducted for International Women’s Day 2013 and found that the majority of today’s working women would prefer a better work-life balance to an increased salary. One of the most important contributors to work-life balance identified by the survey was ‘flexibility,’ with 80% of women saying that having a flexible work schedule is either very important or extremely important to their career success.

International Women’s Day 2013 - Infographic

Here the infographic titled " Making Women Happy - In The Workplace " illustrates the findings of Accenture’s Defining Success research conducted for International Women’s Day 2013.

International Women’s Day 2013 - Infographic

Click here for full report on the research, "Defining Success."

Goto http://www.internationalwomensday.com/, a global hub for sharing International Women's Day news, events and resources.

Are you agree/disagree with this report? Why? Feel free to leave a comment with your experiences. Have a Great Day!
 

The Real Story of Vishwaroopam: World's First Infographic on the Movie! [Infographic]

There is no doubt that Kamal Haasan's Vishwaroopam has created a lot of buzz across the country (India) before and after its release. The film, written and directed by Kamal, has reportedly garnered around Rs. 200 crore worldwide at box offices till now from the date of launch.

Kamal Haasan's Vishwaroopam - World's First infographic on the movie!

Here the world's first Infographic developed by DCI for Galatta.com titled " Vishwaroopam - The Real Story " has all the information, right from its launch to release and all the drama that happened around it.

Kamal Haasan's Vishwaroopam - World's First infographic on the movie!

Are you agree/disagree with this? Why? Feel free to leave a comment with your experiences. Have a Great Day!

Source
 

The Influence and The Power of Social Media [Infographic]

Social media is the easiest, fastest and most explosive way to transmit and receive information! And best of all – absolutely anyone can take advantage of it.

"It has never been easier to be as influential as you can be today. Information is cheap. Information is easier to produce. And if you have a quality message, it's never been cheaper to get out."
Here is the Infographic by DashBurst team titled with " Influence and Social Media " tells about just how influential social media really is!

Influence and Social Media - Infographic

Are you agree/disagree with this? Why? Feel free to leave a comment with your experiences. Have a Great Day!
 

Social Media Statistics 2013 - Facebook vs Twitter vs Pinterest. How You Should Spend Your Marketing Budget? [Infographic]

The Social Media is the the No.1 key for market a business, but some people says that "it is waste of time and money." Have you thought about spending money on social media marketing?, here is the statistics for 2013 across Facebook, Twitter and Pinterest provide us with an interesting opportunity to review where we may want to spend our social media dollars and time in the coming year.

Social Media Statistics 2013

Here the Infographic developed and published by Quicksprout titled “The Social Media Landscape” outlining the major differences between the three popular social networks with some key Social Media Statistics you should be aware of.


Are you agree/disagree with this? Why? Feel free to leave a comment with your experiences. Have a Great Day!
 
 
Copyright © 2012 - 2016. TechSemo - All Rights Reserved.
Techsemo Facebook Techsemo Google Plus Techsemo Twitter Techsemo Stumbleupon Techsemo Linkedin Techsemo Pinterest Techsemo RSS